
Vulnerabilities
Using Survival Analysis to Measure Patch Velocity in Qualys VMDR with Elastic Stack
Survival analysis offers a more accurate view of vulnerability remediation than MTTR by accounting for censored data. By applying it to Qualys VMDR data in Elastic, defenders can quantify patching probability over time, benchmark teams, and pinpoint bottlenecks. This briefing explains the approach and actionable steps.
What Happened
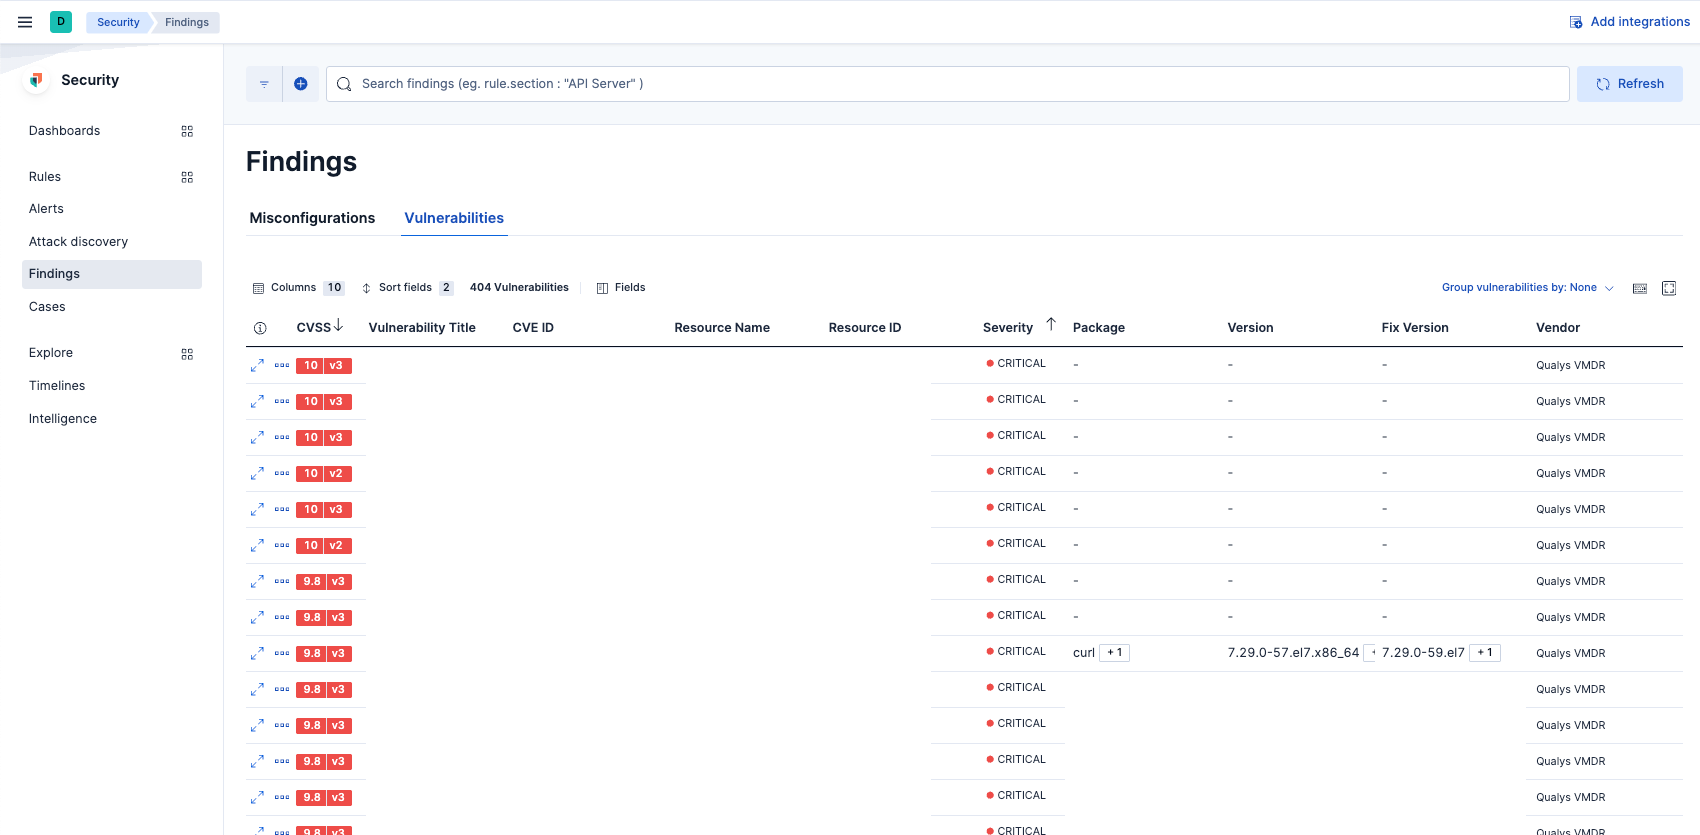
Qualys VMDR data was ingested into Elastic Stack and analyzed with survival analysis to evaluate patching velocity across teams and environments.
Impact
- Revealed that MTTR averages hide long tails of unresolved vulnerabilities.
- Provided probability curves showing, for example, 90% of vulnerabilities patched within 30 days.
- Enabled comparison of team performance against internal SLOs.
Why Survival Analysis?
Unlike mean or median MTTR, survival analysis incorporates censored observations—vulnerabilities still open at the end of the observation window—giving a realistic view of remediation risk.
What to Do
- Ingest VMDR data into Elastic and run a Kaplan–Meier estimator to generate patch‑time survival curves.
- Define SLOs such as “95% of critical CVEs patched within 14 days” and compare against the curve.
- Identify periods where the curve flattens to locate bottlenecks (e.g., testing, approvals).
- Use the resulting metrics to adjust staffing, tooling, or process changes.
Next Steps
Start with a pilot on a single environment, validate the model, then roll out organization‑wide.
Related vulnerabilities

Elastic Introduces Agent Builder & Workflows to Automate SOC Triage
Elastic Stack now includes Agent Builder and Elastic Workflows, allowing security teams to automate alert triage and response. The combination separates deterministic actions from AI‑driven analysis, reducing analyst toil while maintaining auditability.
Read briefing
CVE‑2026‑83678: Windows TCP/IP Heap Overflow Enables Local Privilege Escalation
A heap‑based buffer overflow in the Windows TCP/IP stack (CVE‑2026‑83678) allows a local attacker with authorized access to elevate privileges. Microsoft has issued a patch; administrators should apply it immediately and tighten local privilege controls.
Read briefing
Qualys TruRisk Autonomous Remediation Cuts CISA KEV Fix Time to 14 Days
Qualys has added an autonomous remediation engine to its Enterprise TruRisk platform, slashing the average time to patch CISA‑KEV vulnerabilities from 1 month 19 days to 14 days. The system prioritizes exposures, validates fixes, and deploys them in controlled waves, eliminating over 90 % of remediation noise.
Read briefing
Samsung rlottie Stack-Based Buffer Overflow Leads to Remote Code Execution
A stack-based buffer overflow vulnerability in the Samsung rlottie library, tracked as CVE-2026-91826 with a CVSS score of 7.8, allows remote code execution via user interaction. SecOps and defenders must audit applications utilizing rlottie and apply available vendor updates.
Read briefing